Adding the SSRS Report to Workflow Status Page
If you did not already, create a Project Detail Page (PDP), and set the type of the PDP as Workflow Status.
For this example, I am going to use an existing workflow status page called Proposal Stage Status
Now, edit the project detail page, so that you can add more webparts. We will add two webparts 1) SQL Server Reporting Services Report Viewer Webpart 2) a Query String Filter Webpart


Note: I have the SSRS setup in SharePoint Integrated Mode, but you could do this with native mode installation as well.
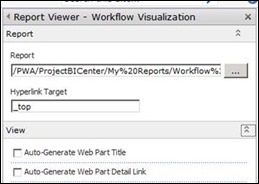
Once you have the webparts added, configure the SSRS report Viewer webpart to locate the report that we developed in previous post.

I prefer that we not display any menu bars, any options so that this will looks like a read-only web part when displayed, but it is up to you.
Now we need to make sure that this report displays relevant information for the project that it is being displayed for. We do this with the Query String Filter Web part.
Configure the query string filter to pull the Project UID from the URL. This is how it is done.
Once you configure that, we need to set the connection to the report webpart we added in previous steps.
Click on Edit Web part >> Connections and select the Send Filter Values to the Report Viewer option as shown below.

This will send the Project UID from the URL as a parameter to our Report. If you remember, we set our report to look for the parameter project UID. So it matches both the ids and displays the current workflow status.
Click OK and close everything.
Make sure that this is the Workflow Status page that is used in all your project stages.

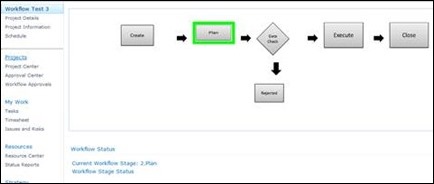
That’s it. So now when you open the Workflow status page of any project, this report displays with the relevant workflow stage highlighted. Of course, you can go fancy with this and develop a much cooler looking report and visualization, this is just a starting point.

Leave a Reply