In a recent MPUG Web-n-Learn, I demonstrated building a quick Timesheet Status Report using OData in Project Online.
The report itself is not too complicated to build, but it helps show another example as to how OData could be used for reporting. This could also very easily be replicated for Project On-Premises as well.
I will assume that you are using Project Online, and have Timesheet data populated.
-
Start by opening up Excel 2013, and navigating to Data >> From Other Sources >> From OData Data Feed
-
On the Data Connection Wizard pop-up, type in the link of your project online tenant, in this format, and click Next.
This will bring up a list of all the data tables that are available to you for reporting. Select Timesheets from that, Click Finish to , complete the data connection wizard .
You will be prompted to select one of the options to pull the data in. For now, select Table.
This will bring in all the data from your Project Online Tenant, as it exists in the Timesheets DataSet. This might take a few minutes, depending on the amount of data you have, which is why it is important to learn how to filter the data via the query BEFORE you consume it. (a post for some other day).
Now select all the data, and click on Insert >> Pivot Table, and select to place the data in a new worksheet.
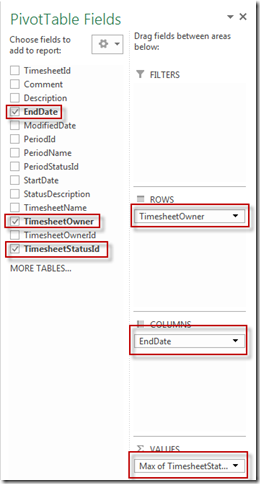
Once the Pivot Table is created, set the fields as shown. We will be reporting by “Week Ending”, so I chose the period end date. Alternatively, you could use the Start Date as well.
Once, all the fields are in place, you will see something like this.
The value TimesheetStatusID represents the status of Timesheets, in number format. Here is the legend for the status ID.
Knowing this, we could now do some conditional formatting, based on these values. Click on Conditional Formatting button on the ribbon, and select Manage Rules.
Setup your rule, as below. Obviously, my conditions do not cover every possibility (like Pending Submit etc.,) , but I leave that up to your excel skills to come up with the conditional formatting rules.
This will turn the table to something as below.
Now, clean it up and Jazz it up a little, and publish to Project Online, to get a report like this:


October 30, 2014 at 2:48 pm
Hello Prasanna Adavi, I would like to do the same report with tasks, is it possible? thanks. Leonardo Carvalho
October 30, 2014 at 2:48 pm
Hello Prasanna Adavi, I would like to do the same report with tasks, is it possible? thanks. Leonardo Carvalho
February 14, 2015 at 4:17 pm
Hi Prasanna, I would like to add some complexity:
I would like to create the same report but add a filter for the resource manager.
As you know the resource manager is a field located in the "resources" OData. I would need to have a datafeed such as:
/_Api/ProjectData/Resources()/?$Select=
AND
/_Api/ProjectData/Timesheets()
As soon as I have these two feeds in a Excel I link them using the power pivot data model. And create the report. All is well, but when I publish it to Project Online it will never refresh from the browser.
Refreshing on Excel 2013 client works without any problem, so the connection files are correct.
Is there an aditional action that I need to perform when I have multiple ODATA feeds in a report?
Hope you could shed some light here,
Erik
February 14, 2015 at 4:18 pm
As far I know, For the reports to refresh in project online you either need to subscribe to power bi or do this:
http://blogs.office.com/2013/03/29/project-online-and-excel-web-app-cloud-data-improves-reporting/
July 26, 2015 at 2:58 am
This is great – I need my report to show time daily – is that possible?
July 26, 2015 at 3:00 am
I am not sure I understand the context. Are your time periods by day? I would assume you could use AssignmentTimephasedDataSet, OData feed, but I have not tried it yet.
April 13, 2017 at 10:44 am
I need to get actual time posted by resource/project/task (including administrative time). Would you be able to offer some guidance on how to get this information using ODATA? Thank you in advance.
May 8, 2017 at 6:28 am
You should be able to use the TimesheetLineActualData OData feed to build this report. Here are some instuctions on how to use this: https://msdn.microsoft.com/en-us/library/office/dn776317.aspx