While, this can easily be looked at by opening either the user details or the Group details, it might be cumbersome when you are working with a large number of resources. Another use case might be, when you have to provide your Client a quick listing of all resources and their assigned Security Groups as a deliverable of your implementation.
Here is a way to build a quick and simple report of these details, and make use of Excel/Excel Services to display them.
Note/Disclaimer: This report involves the querying of the Project Server Published database, and this is not officially supported by Microsoft. Please know this, before you attempt building the report.
Step 1: Build the Data Connection
The tables that store the information that you need for this report, are in the Published Database. Since we want to use Excel to surface this data, our first step is to build the data connection.
Note: You need to have at least dbreader permissions on the Published database for you to be able to build/access this report.
- Open a blank Excel document.
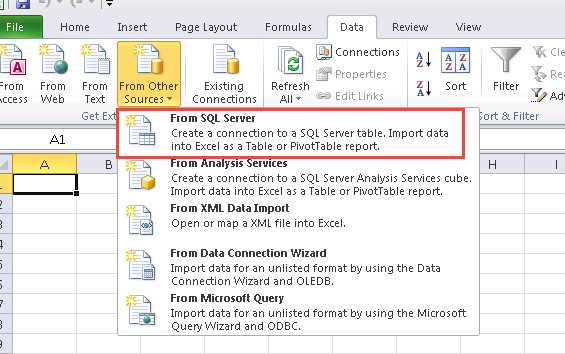
- Click on the Data tab and select the SQL Server as the data source
- On the Data Connection Wizard Box, fill in the details of your SQL Server

- Next, select the Project Server Published Database from the drop down list. This will bring all the tables that are available as part of this database. Select the MSP_Web_resources table (actually it does not matter which table, as we are going to be changing the Connection string anyways)
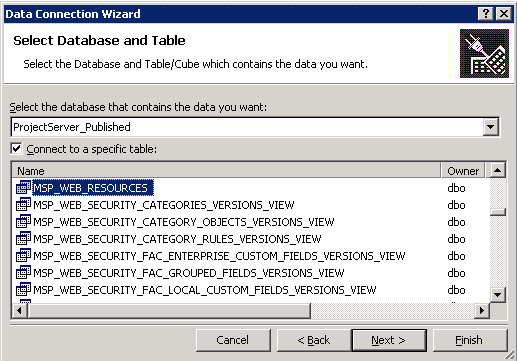
- Click Finish to see the screen below
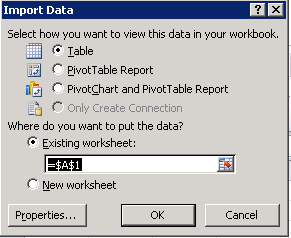
- Once you hit Finish, Excel will prompt you to select the cell where data is placed. Click OK and let Excel pull the data in.
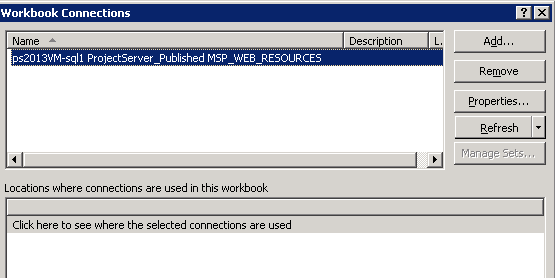
- Now Click on Data >> Connections to bring the screen below, and click the Properties >> and then the Definition tab
- Now, change the Command Type to SQL, and paste the following query in the Command Text box.
SELECT
MSP_WEB_SECURITY_GROUPS.WSEC_GRP_NAME,
MSP_WEB_RESOURCES.RES_NAME
FROM
MSP_WEB_SECURITY_GROUP_MEMBERS
INNER JOIN
MSP_WEB_RESOURCES ON MSP_WEB_SECURITY_GROUP_MEMBERS.WRES_GUID = MSP_WEB_RESOURCES.WRES_GUID
RIGHT OUTER JOIN
MSP_WEB_SECURITY_GROUPS ON
MSP_WEB_SECURITY_GROUP_MEMBERS.WSEC_GRP_GUID = MSP_WEB_SECURITY_GROUPS.WSEC_GRP_GUID
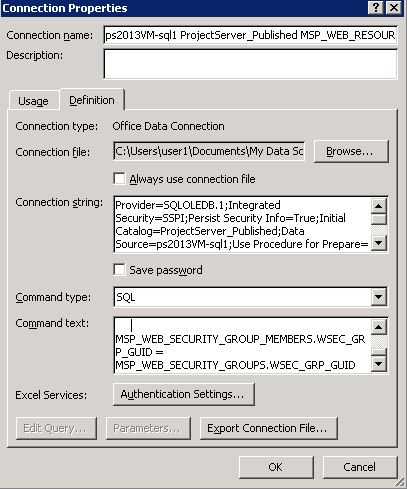
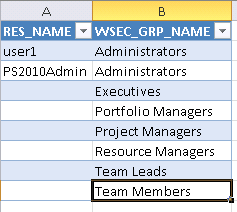
- Click OK and then Close. Now you should see the data coming in a table format, as shown below.
- Now you can Pivot the data for better visualization. Click on Insert >> Pivot Table
- Click choose connection and select the connection you just saved.

Now add field to Pivot Table, to see something like this:
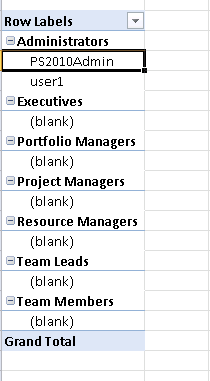
There, you have it, a report which shows users in their respective groups.
Now, I would assume this report will be mainly for the Administrators and you might want to keep accessing directly from within Excel.
If you want to display this in PWA and through Browser, you need to 1) Export the Data connection to the ODC library in BI Center 2) Configure the Authentication Settings for Excel Services.
Hope you find this helpful.
April 17, 2012 at 7:24 pm
Perfect input for all of us consultants. This can really help us in our analysis work. Thanks!
March 1, 2013 at 9:56 am
Just what I needed! Thanks!
April 17, 2013 at 9:37 pm
Glad it was of help!!
November 12, 2015 at 6:32 pm
This is great. Thanks Prasanna !!
November 12, 2015 at 6:32 pm
Prasanna,
Very helpful article. Quick question, does this only show Active users?
thanks,
Parthiv