Step 3: Preparing and Publishing the Chart to Excel Services
Continuing with my previous post, once we have the milestone chart, we need to publish it to Excel Services.
To start with, Name the Parameter you want the report to use. In our case, it is the Project UID.
- Select the cell, which indicates the values for the filter for Project UID.
- Click on Formulas >> Define Name and define a name for the parameter
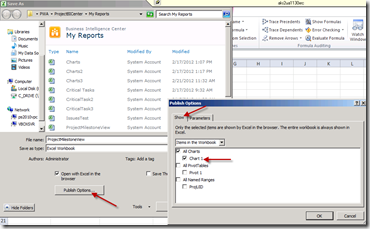
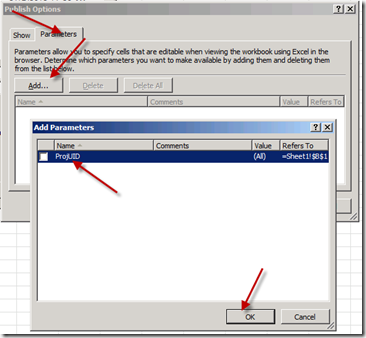
- Once the Name is set, then click on File >> “Publish to Excel Services” and select the options as shown below.
This will set Project UID as the parameter for the Excel Services Report. Initially since ALL projects are selected, this report will show ALL milestones from all projects.
Step 4: Add this report to the appropriate PDP and make sure the context filters are set
Now that we have the Excel Services Report, we are ready to use it on our Project Details Pages.
I will use the Schedule PDP to add this report.
- Navigate to Server Settings >> Project Detail Pages >> Schedule
- Once in the PDP, click on Site Actions >> Edit Page
We will Insert 2 Web parts on this page:
- Query String Filter Web Part
- Excel Web Access Web Part
Once these two are added to the page, set the options for the Excel Web Access Web part as shown below. You could also modify the Appearance Settings to make sure the web part fits well on your screen.
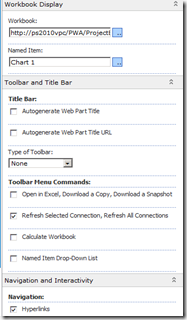
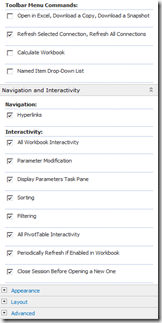
For the Query String Web part, set the web part options as below. Please pay special attention to the Advanced Filter Options.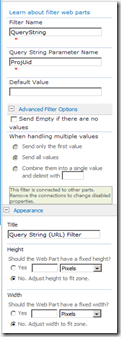
Once these web parts are set, you will need to connect them.
Step 5: Connect the Web parts
From the Query String Web part options, select Connections >> Send Filter Values to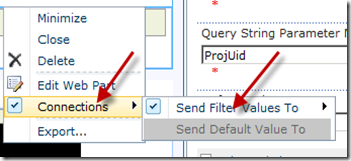
and select the Filtered Parameter as ProjUID (that we set earlier).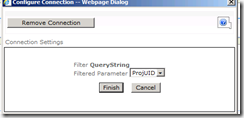
That’s it. Stop editing the page, and your view should now work for each project on an individual basis.
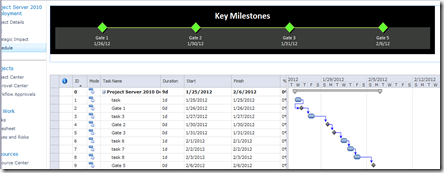
Navigate to the project Center and view the schedule PDP, and it show the milestones for that project.
The View should Refresh with updates on your project (Although I noticed slight elay with EXcel Services Refresh)
Obviously, this report could be enhanced per your needs, and more filters could be added as necessary.
Leave any comments you have. Hope you will find this useful.


February 27, 2013 at 10:06 am
Hi Prasanna, would like to know if excel file needs to refresh manually to have latest milestone details?
when i tested this it works well but it is not updating latest added milestones.
Please suggest
Thanks
April 17, 2013 at 9:37 pm
Mohit,
Sorry for the late reply. Yes, it should refresh automatically. But as I mentioned in the post, there is a slight delay, which I presume could be adjusted. I did not need to open it in excel to refresh.
May 5, 2014 at 7:08 pm
I would love to see a modified version of this instruction set for Project Online, as the OData layer I believe impacts this. Do you have an example of how to do this in Project Online? Thanks.
May 5, 2014 at 7:10 pm
@Brian – Well, with Project Online now, you get the Timeline Webpart. While you will have to manually add what you want to show, it kind of replaces the workaround we had to do in 2010. I will still look into doing this as a report, just out of curiosity.
October 7, 2014 at 7:56 pm
Hi Prasanna,
I have followed all of the steps, worked fine, But the filter part did not work on the excel web access web part. Project UUID filter did not work, but I can see all the Projects milestones in the excel window. Could you help on that part?
July 10, 2015 at 2:29 pm
Hi Prasanna,
I did exactly as you described, except that I'm publishing a table and not a chart, but I get the following message in Excel Web app webpart: "as a result, none of the parameters have been set". The 2 webparts seem to be correctly configured but the parameters is not correctly sent to the table and I can't figure out…
Do you have any idea?