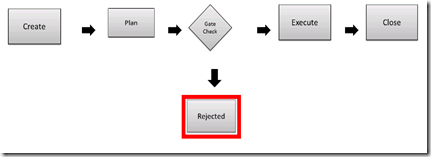
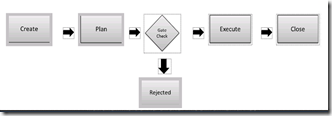
- You can go with the Workflow Visualization Solution Starter Web Part here: http://archive.msdn.microsoft.com/P2010SolutionStarter . However, the issue with this web part is that it can only visualize linear workflows. Even when you use it for a branching workflow, it shows the stages as linear. For example, you cannot do something like this:
- You could create a workflow status page for each of your stages, and add a static image with the appropriate stage high lighted. This works, and is a no code solution, but is cumbersome and will result in several Workflow Status pages. (A Blog post on this some time later)
- I have used Nintex, and while Nintex provides a workflow visualization and there is nothing wrong with it, it is VERY detailed and not the one that is suitable for a PMO or executive look.
- Use a SQL Query to surface the Project UID and the Stage GUID.
- Build SSRS Report which consists of your workflow diagram.
- Format the objects on the SSRS Report to change color based
So lets get on to it
Step 1: Create the SSRS Report
In the interest of brevity of this blog post, I am not going to go into the detail of HOW to build the SSRS Report. The report is available for a free download at the end of this blog post. However, here are the key elements:
The Query
We are looking for the current stage that the project is in and the its corresponding GUID. So we use the following query.
1: SELECT TOP (100) PERCENT
2: dbo.MSP_EpmProject_UserView.ProjectName,
3: dbo.MSP_EpmProject_UserView.ProjectUID,
4: dbo.MSP_EpmWorkflowStage.StageUID
5: FROM
6: dbo.MSP_EpmWorkflowStage INNER JOIN
7: dbo.MSP_EpmWorkflowStatusInformation ON
8: dbo.MSP_EpmWorkflowStage.StageUID = dbo.MSP_EpmWorkflowStatusInformation.StageUID
9: INNER JOIN
10: dbo.MSP_EpmProject_UserView ON dbo.MSP_EpmProject_UserView.ProjectUID = dbo.MSP_EpmWorkflowStatusInformation.ProjectUID
11: WHERE (dbo.MSP_EpmProject_UserView.ProjectUID =@ProjectUID) AND
12: (dbo.MSP_EpmWorkflowStatusInformation.StageStatus = 1)
You will also need a parameter for Project UID, so here is the query for the parameter.
1: SELECT
2: dbo.MSP_EpmProject_UserView.ProjectUID,
3: dbo.MSP_EpmProject_UserView.ProjectName
4: FROM
5: dbo.MSP_EpmProject_UserView
The LayOut
Now lay out the report per your workflow. I have a very basic diagram, but you could go as fancy as you like.
The Trick
Now the crucial part. For each of the blocks representing the stages, write an expression for the border, similar to this. where StageUID is the UID of the stage that block represents.
1: =First(Fields!StageUID.Value, "DataSet1")="StageUID","Green","White")
That’s it. Now Test run to make sure that the report actually works. Once the report is ready, it is very easy to add it to the Workflow Status page. I will cover that in my next blog post.
BTW, here is the link to download the completed report. Please download and use it at your own risk. And test it in a TEST environment before deploying it to production.
This article has been cross posted from http://epmablog.com


Leave a Reply